

Predicting the Future - Part 1
My Crystal Ball
Oracles, seers, witches, psychics and mediums often have the gift of precognition. Noticeably absent from that group are real estate professionals. My crystal ball broke a really long time ago and I can’t seem to find anyone to fix it. It’s important to remember that no one has the ability to foresee what will happen in a real estate market. The best any analyst can do is study various economic indicators and potentially make an educated hypothesis. For the next series of blog posts, I will do just that: analyze the past, compare current conditions, and try to make sense of where the market is going.
For Part 1 of the series, it’s important to start with the basics. Economics 101 teaches basic economic principles; the most basic being supply and demand. It seems like a very simple concept: demand goes up and supply stays the same, then prices go up. Conversely, if demand stays the same and supply increases, prices will go down. This principle holds true whether we are talking about vegetables at the Nevada City Farmers Market or the housing market in Alta Sierra.
In a previous bog post (August 2018), I analyzed all sales in Nevada County since September 2000. It isn’t new to anyone that there was a market peak in early 2006 followed by a crash that bottomed out in 2012. The analysis showed that March 2006, specifically, was the month that values seemed to top out. Today, the overall Nevada County market has since recovered to near peak values.
Lets look at three key factors of supply and demand within the Nevada County market: volume (Number of Sales and Listings), inventory (and overall marketing times) and prices.
2014-2018
The past four years the Nevada County market can be defined in three words: Hot, Hot, Hot!

Volume from 2014 - 2018 has been seasonally cyclical with slightly more new listings, followed by increased sales in the following months. Overall new listings and sales have been fairly stable indicating an average of 120 sales per month (county wide).

Inventory and marketing times have steadily decreased over the past four years. Marketing times tend to peak slightly higher in winter months and dip during summer months. Since March 2018 inventory as slightly risen from 2.2 to 4.1 months.

Median and Average Prices have risen steadily over the prior 4 years. There are slight dips in some winter months due to lower overall sales and lower priced homes sold during the winter. On average, the market has increased approx 8% per year increasing 32-37% over the full 4 year period.
2004-2008
Since values were at their highest at the at the beginning of 2006, it’s important to look at economic factors leading up to and after the peak.
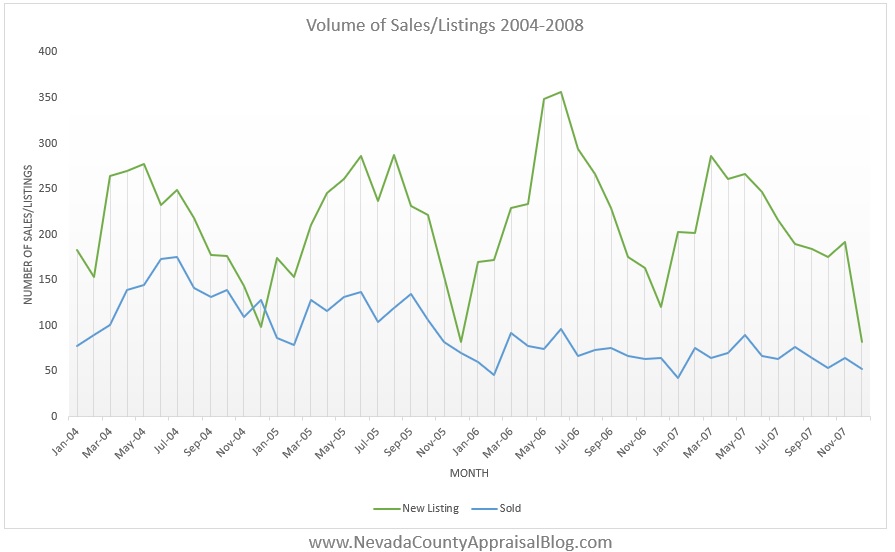
Listings were similarly cyclical with less homes being listed during winter months. Sales on the other hand were consistently declining over the entire four year period. Sales averaged 129 a month in 2004 and declined to 65 a month by the end of 2007. That’s a 50% decline in monthly sales over a 4 year time period. The number of listings also skyrocketed in 2006. From March to August, 1,730 homes were newly listed on the market. Compare that with 480 homes sold in that time period (80 sales per month). That equates to almost a 22 month supply of newly listed homes in just that 6 month time period. This is considered flooding the market.

Monthly inventory began to spike in September 2005 and marketing times began to increase at the exact same time. Monthly inventory went from 7.6 months in September 2005 to 28.5 months in January 2007. That’s a 376% increase over 16 months. Average days on market rises from 44 days in September 2005, to 117 days in January 2007; an increase of 266%.

All of these indicators help to predict something according basic economic principles. Increased inventory and marketing time (supply) combined with declining sales (demand) cause overall prices to decline. Median and average prices peaked from June 2005 - March 2006 and started their decent. Prices continued to decline until early 2012.
Then and Now
Does 2004-2008 compare to 2014-2018? More specifically, does the data from March - August 2006 correlate to March - August 2018? Is the sky falling?

In terms of volume there is one key difference: sales. Average sales per month have held strong in the current market averaging 136 sales per month. Sales are typically stronger during summer months. When values were peaking in 2006, June was the high sales month at 96. However, in June 2018 there were 164 sales.
The strong sales this summer have kept inventory relatively low- an average of 3.3 months. This is much lower than in 2006 when inventory was 15.9 months. Marketing times have also been considerably lower at 43.8 average days on market compared to 73 average days on market in 2006.
Average and Median sale prices are similar to what they were in 2006 (as we previously analyzed). The monthly average sold price is 94.7% of what it was in 2006 and the monthly median price is 98.8%.
In Conclusion - Part 1
Based on these basic supply and demand indicators, there’s no need to panic yet. Since values were the last indicator to change when the market crashed in 2006, there would be no reason for values to decline if there is a limited supply and high demand as there is now. One thing to closely monitor is a spike in inventory or slowing demand. This is reflective in the months of inventory and directly correlates to marketing times.
In Part 2 of this series, I’ll examine other economic indicators on a local and national level such as unemployment rate, labor force, interest rates and distressed sale percentages to see how they potentially impact either supply or demand of the local housing market.
The best we can do as real estate professionals is to be educated on past and current factors and clearly communicate them to our clients. If I’ve missed something or you’d like me to address something specifically please do not hesitate to ask. I can be reached at brian@snappraisal.com or by phone/text and 530-632-3428.

