
Springing into the Summer Market

Thunderstorms, rain, and pea-sized hail make it seem like its the dead of winter, but spring is, in fact, winding down and it’ll be summer before you know it. That means BBQ’s, the Nevada County Fair, and heading to the river. It also means a large increase in housing sales. Historically, sales of residential homes in Nevada County can double or even triple when compared with winter months. Lets take a look at how the 2019 market is shaping up.
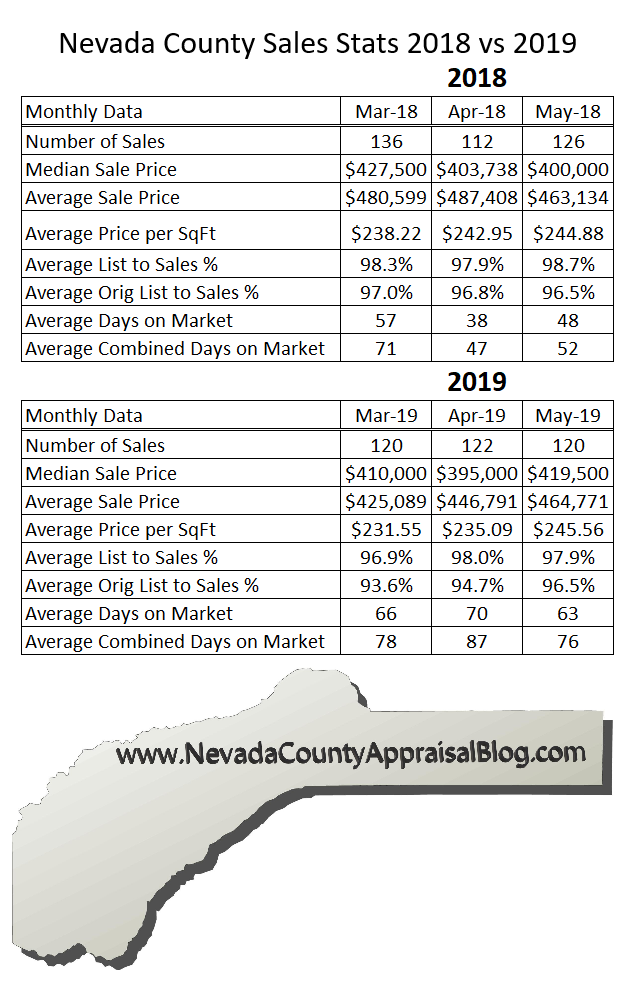
Looking at the data, this spring has been pretty comparable to spring of 2018. The number of sales remains strong with 537 total sales in 2019 YTD compared to 545 in 2018 through May. Comparing March - May 2019, we see 3.2% less sales than 2018.
During the last couple of years, prices appear to be overall stable. There are seasonal fluctuations in median and average prices, but no dramatic appreciation like in years past.
Original list prices to selling price percentage jumps out in March and April in 2019. This indicates that a seller may think their house is worth slightly more than it ends up selling for. Because sellers are pricing higher than market value, Days On Market (DOM) increases until listing prices are lowered. DOM and Combined Days on Market (CDOM) have both increased in 2019.
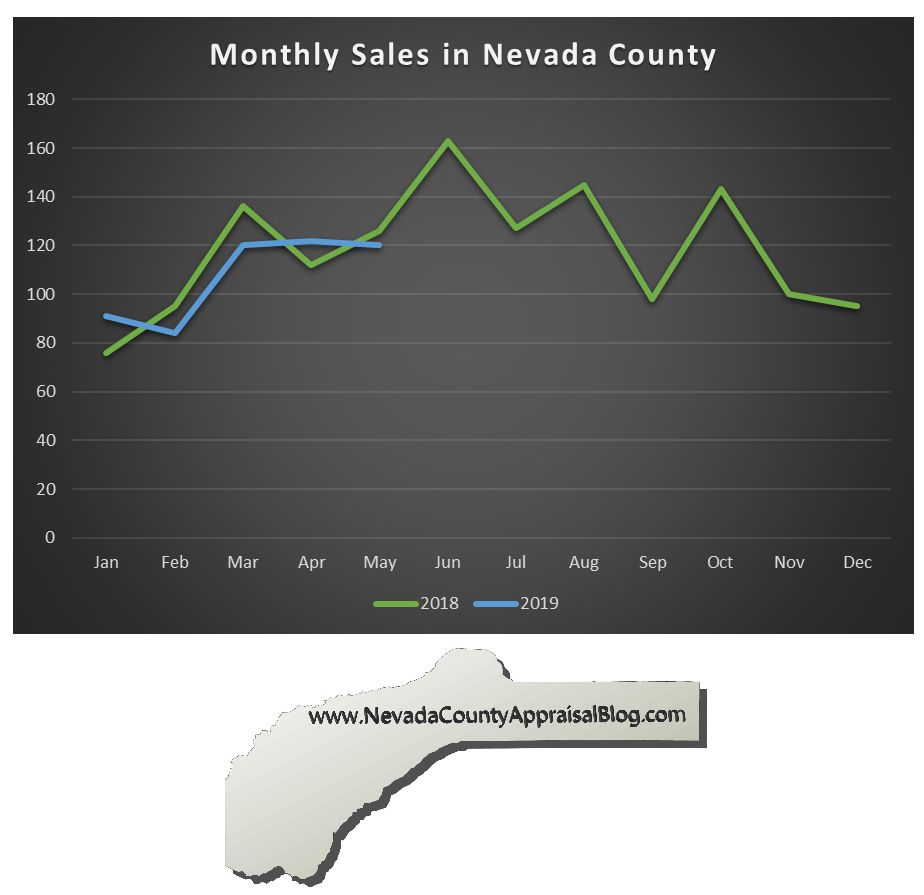
So far in 2019, monthly sales in Nevada County have been right on par with 2018. Real Estate Agents are working hard to close escrows in 2019 with an average of 107 sales a month. If the market is anything like 2018, sales should satay strong through summer.

Prices remain fairly consistent with 2018 as well. Both the median and average prices are very consistent between 2019 and 2018. If you bought a house within the last year or so, the value probably hasn’t decreased. However, you don’t have that instant equity buyers were getting in 2013-2016.

Days On Market has increased substantially in 2018. Monthly Average DOM has increased an average of 27% or 12 days in 2019. This is directly due to homes being overpriced when originally listed.

There are currently 513 homes listed for sale in Nevada County. Based on the average sales per month in 2019, this equates to a 4.8 month supply currently listed. This is slightly higher than 2017 and 2018, but less than the peak supply in August 2018 (5.8 months). In 2009-2010 it was typical to see 16-20 months supply of homes on the market.
Spring Market Conclusions
Prices are stable; both median and average sale prices indicate no appreciation or depreciation between 2018 and 2019. Supply is slightly higher than in years past but remain substantially lower than at the bottom of the market. Marketing times have increased over 2018. This appears to be directly due to higher listing prices.
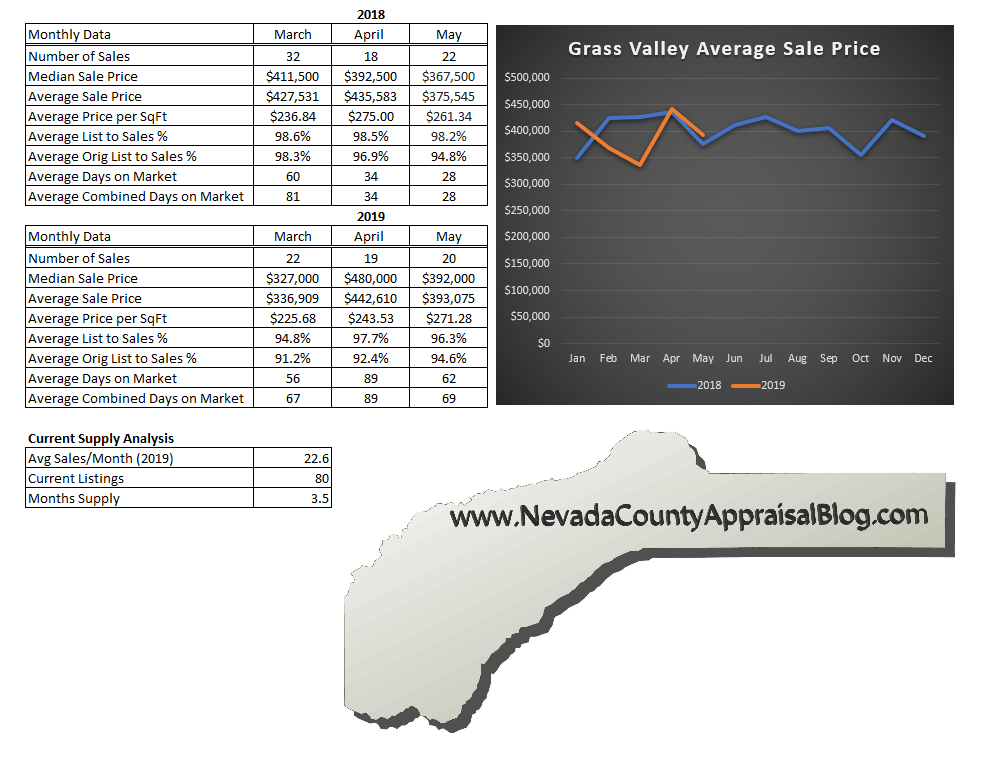
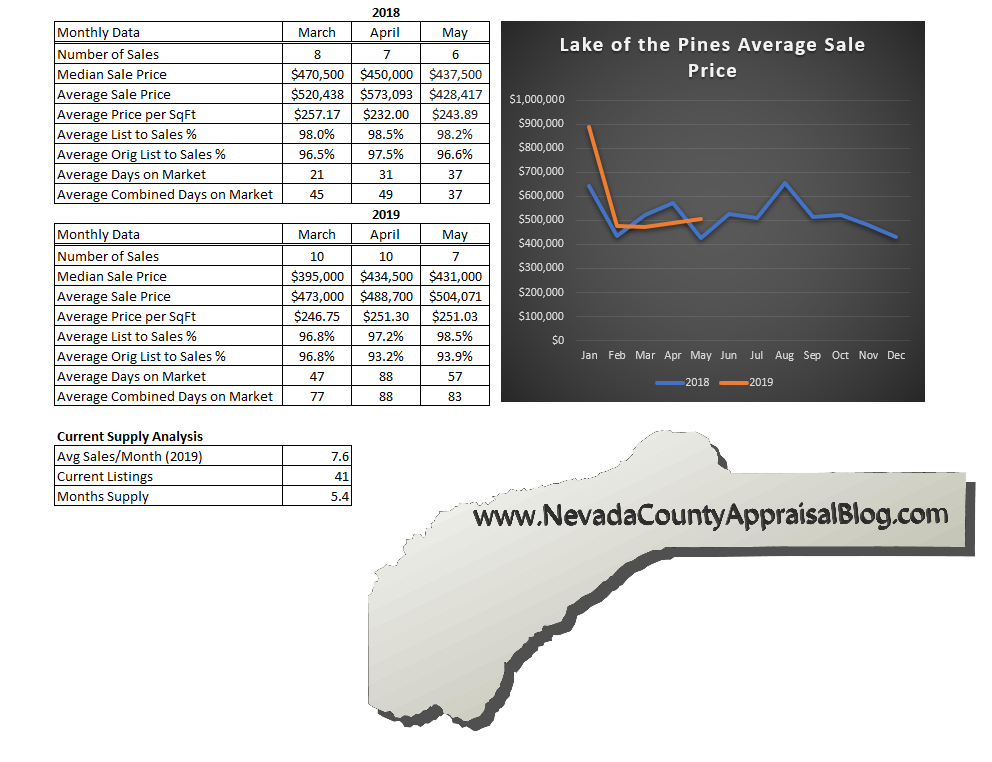
Individual Markets
County-wide statistics give is a good idea on how things are going in general but it’s also important to look at individual markets. What’s happening in your neighborhood? I’ve included data and graphs for Grass Valley, Nevada City, Lake Wildwood, Alta Sierra, South County/McCourtney and Lake of the Pines. These numbers are especially helpful when I am completing an appraisal in these areas.